
使用 Prometheus & Grafana 监控你的 Spring Boot 应用
项目已托管于 GitHub:y0ngb1n/spring-boot-samples,欢迎 Star, Fork 😘
准备工作
- Prometheus
v2.14.0 - Grafana
v6.5.0
使用 Docker 部署上面的基础环境,配置文件可见 docker-compose.yml,输入以下命令进行一键部署:
# 检查配置 |
添加依赖项
pom.xml
<dependencies> |
application.yml
spring: |
使用方式
Step 1: 启动服务
mvn spring-boot:run |
Step 2: 访问 /actuator/prometheus 端口
curl -sS http://127.0.0.1:8080/actuator/prometheus |
将应用与 Prometheus 对接
添加 Prometheus 的配置文件:prometheus.yml
scrape_configs: |
可使用 ifconfig 查看宿主机的 IP 地址,Prometheus 服务器就会自动每隔15秒请求 http://your-ip:8080/actuator/prometheus。更多配置参见 👉官方文档
测试访问 Prometheus
STEP 1:在浏览器中访问 http://localhost:9090
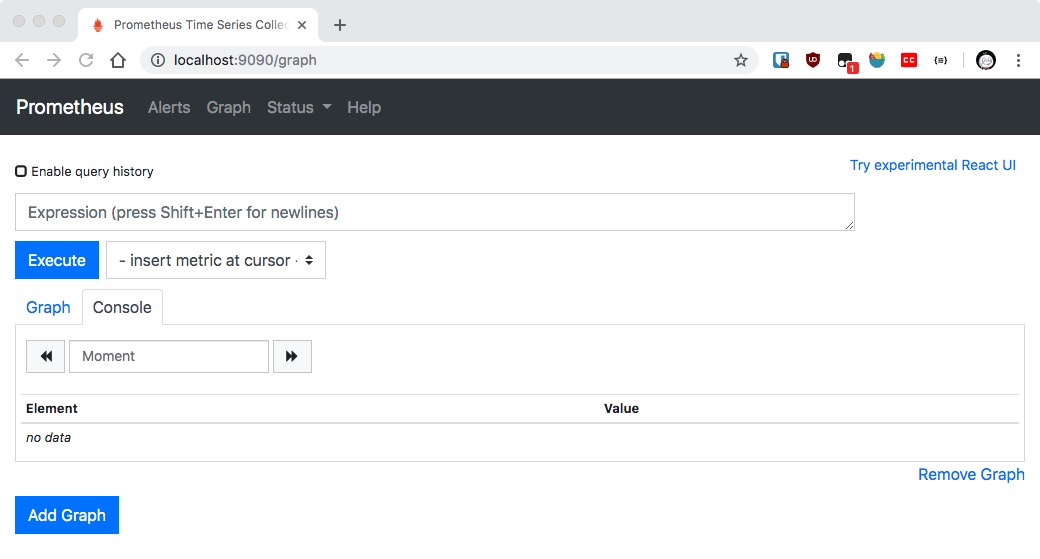
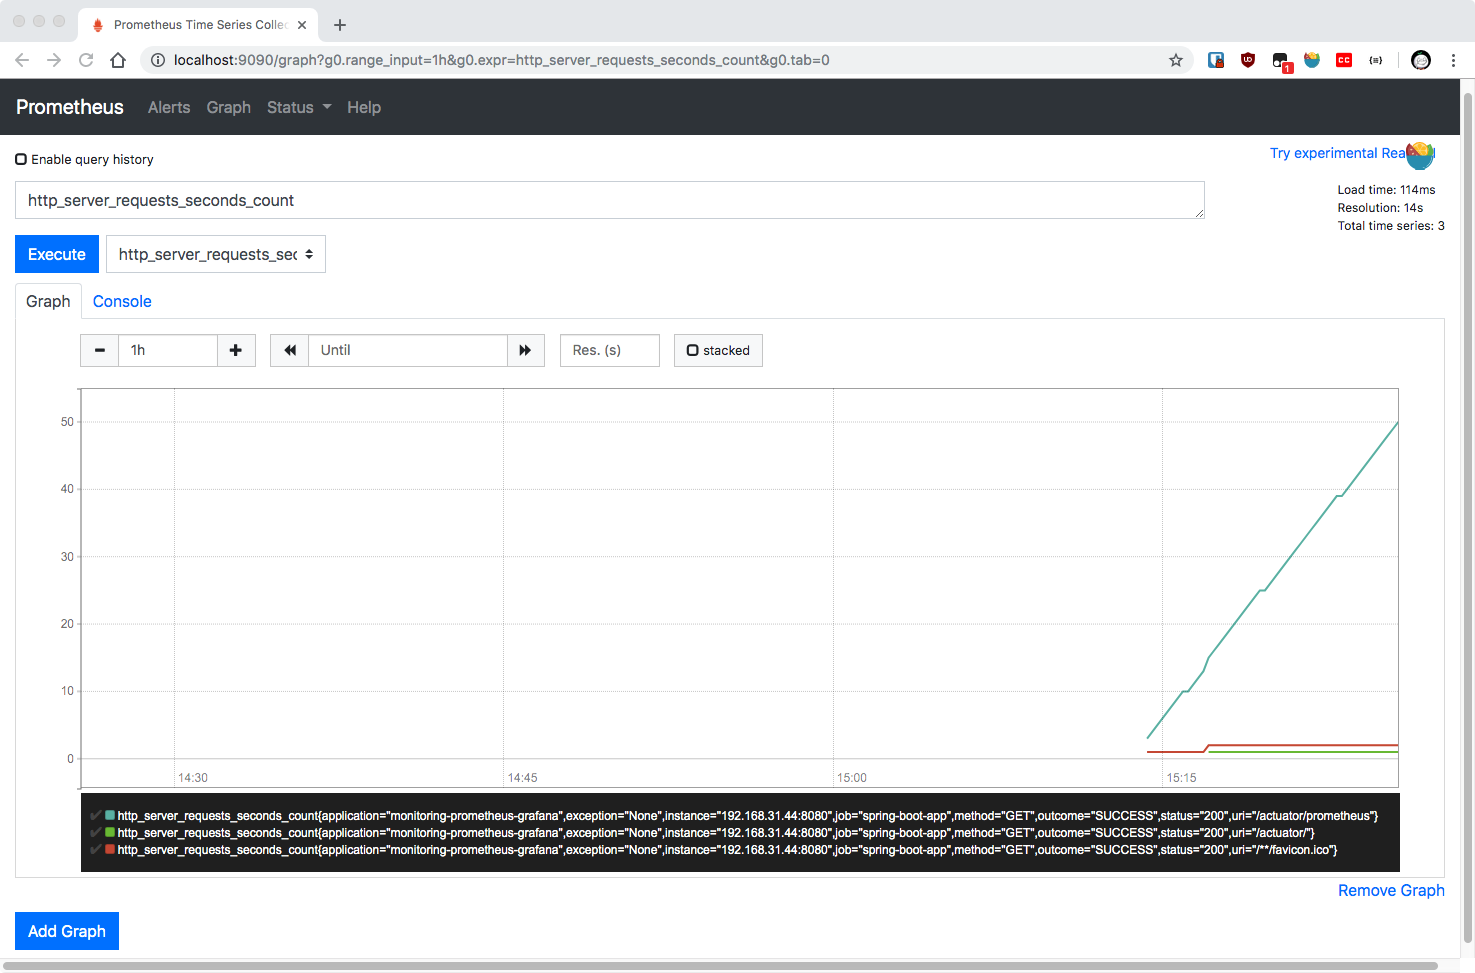
STEP 2:查看监控数据
- 点击
Insert metric at cursor,即可选择监控指标; - 点击
Graph,即可让指标以图表方式展示; - 点击
Execute按钮,即可看到类似下图的结果。
集成 Grafana 可视化
前面已经使用 docker-compose 启动了 Grafana,下面进行配置。
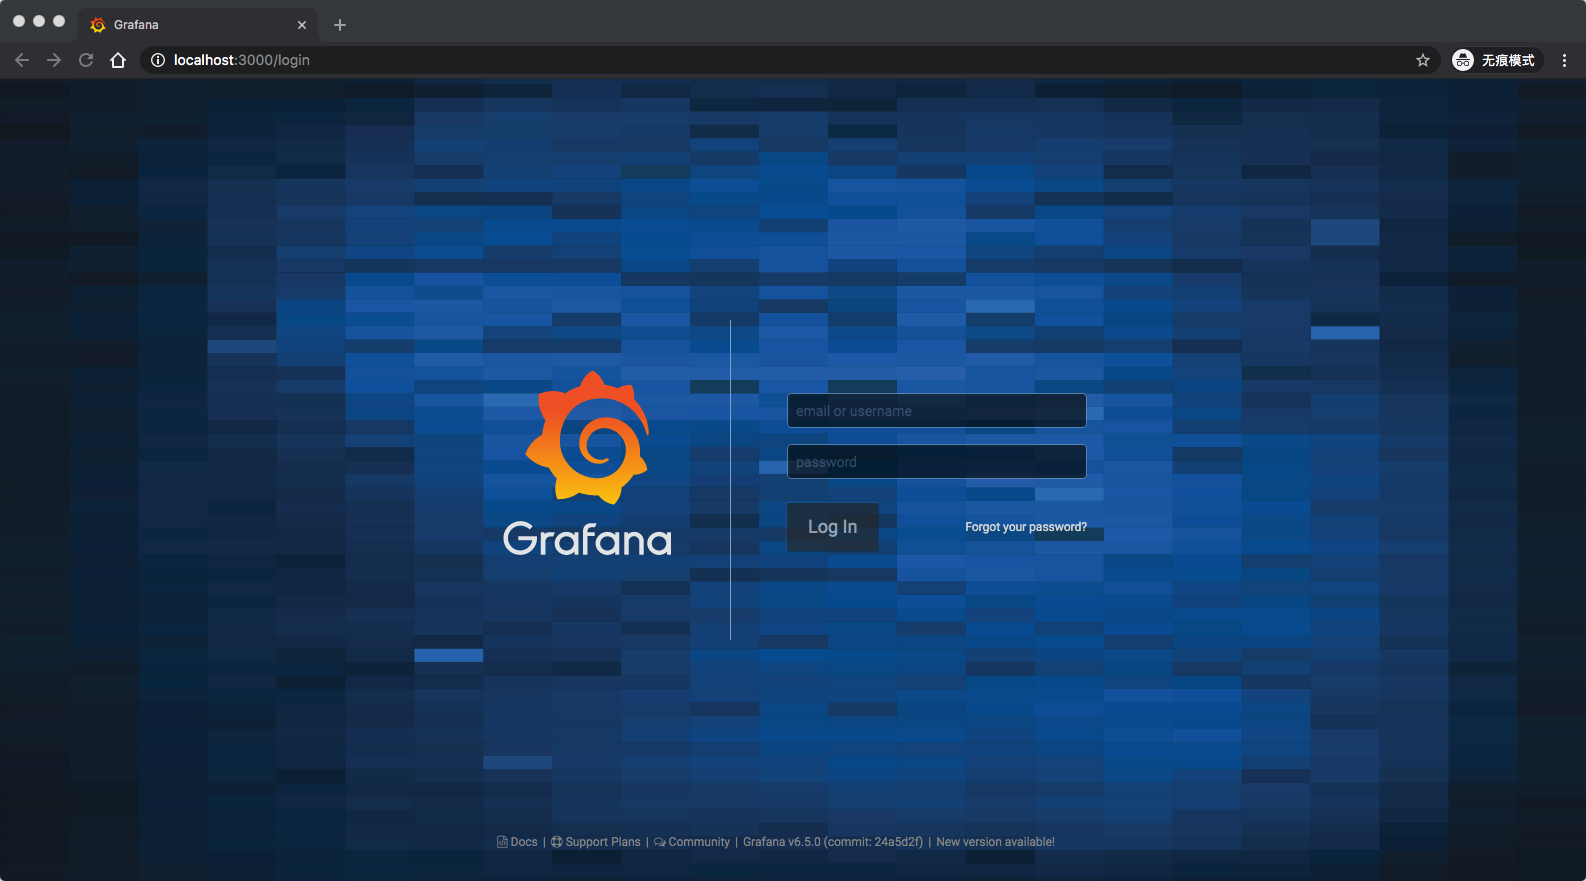
STEP 1:在浏览器中访问 http://localhost:3000,并使用初始帐号 admin:admin 进行登录
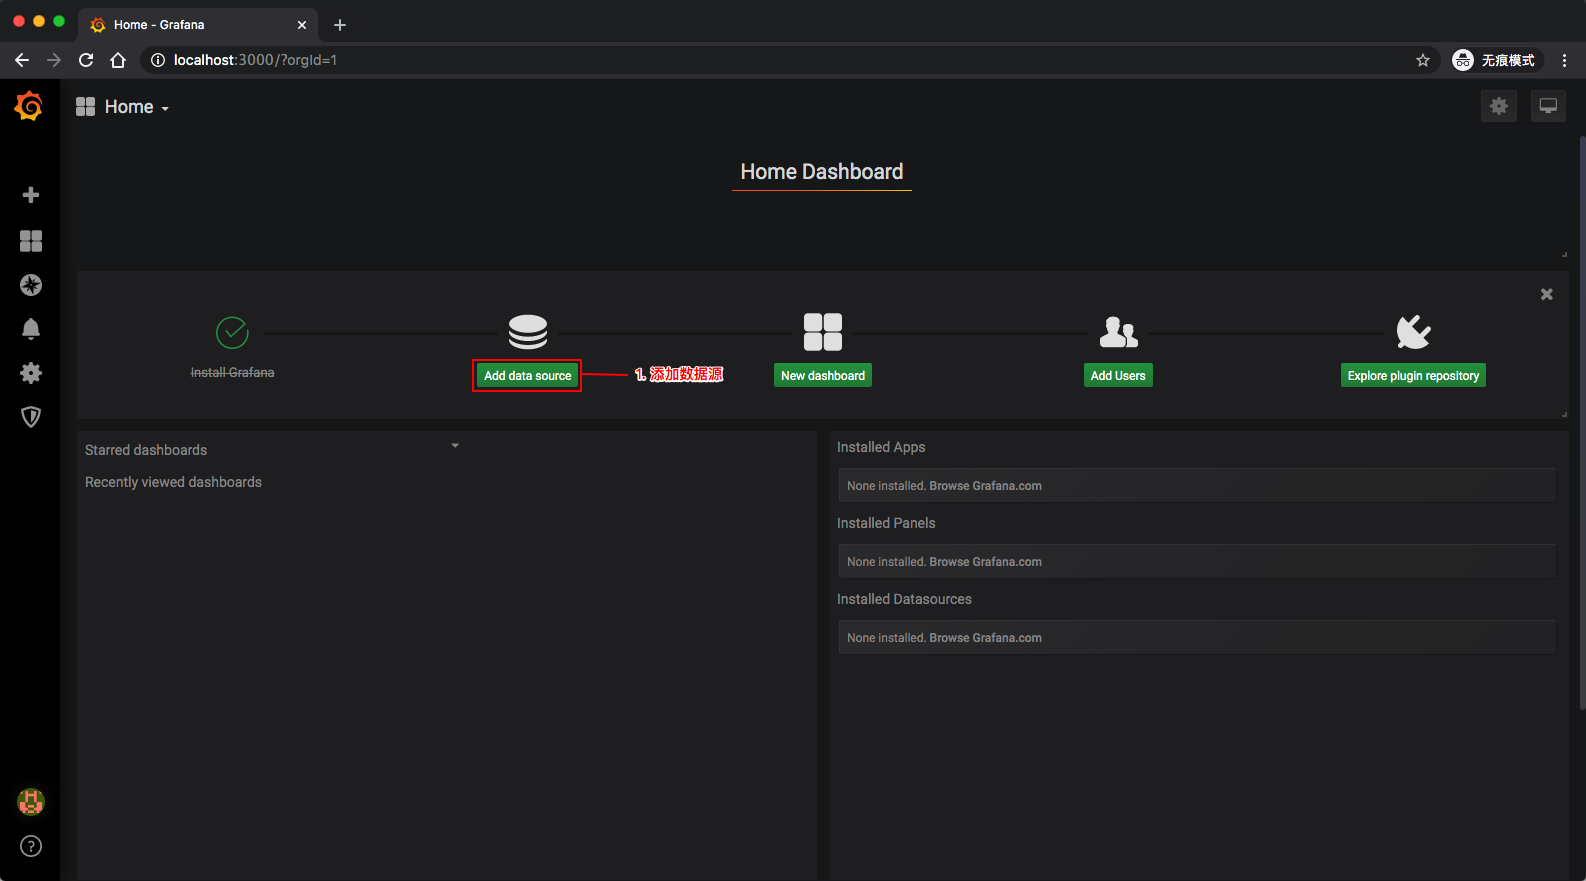
STEP 2:点击 Add Data Source 进行添加 Prometheus 数据源
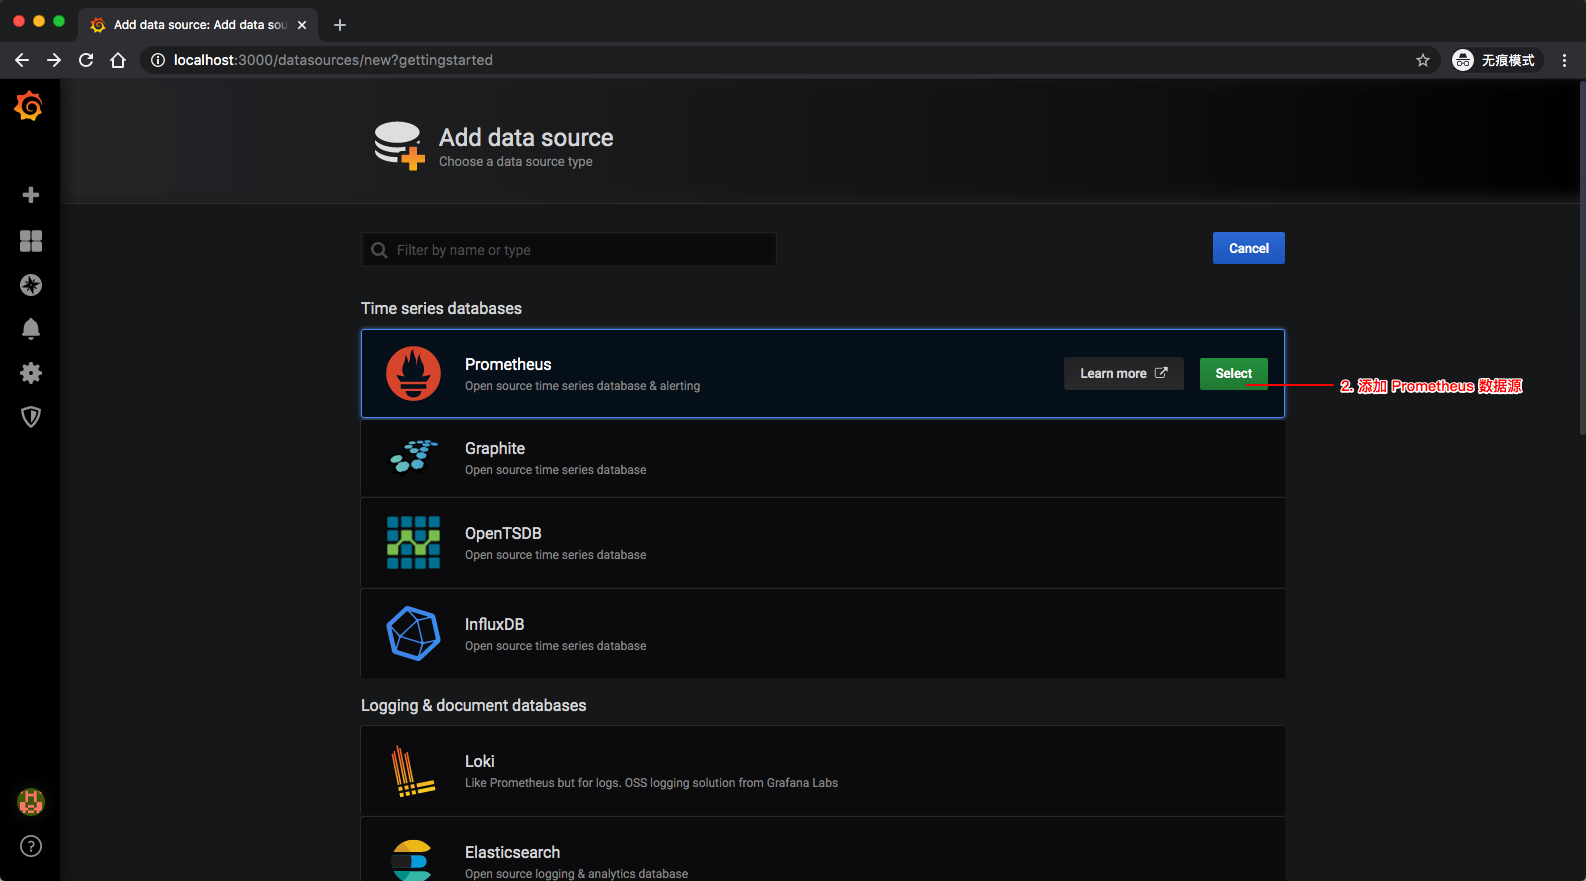
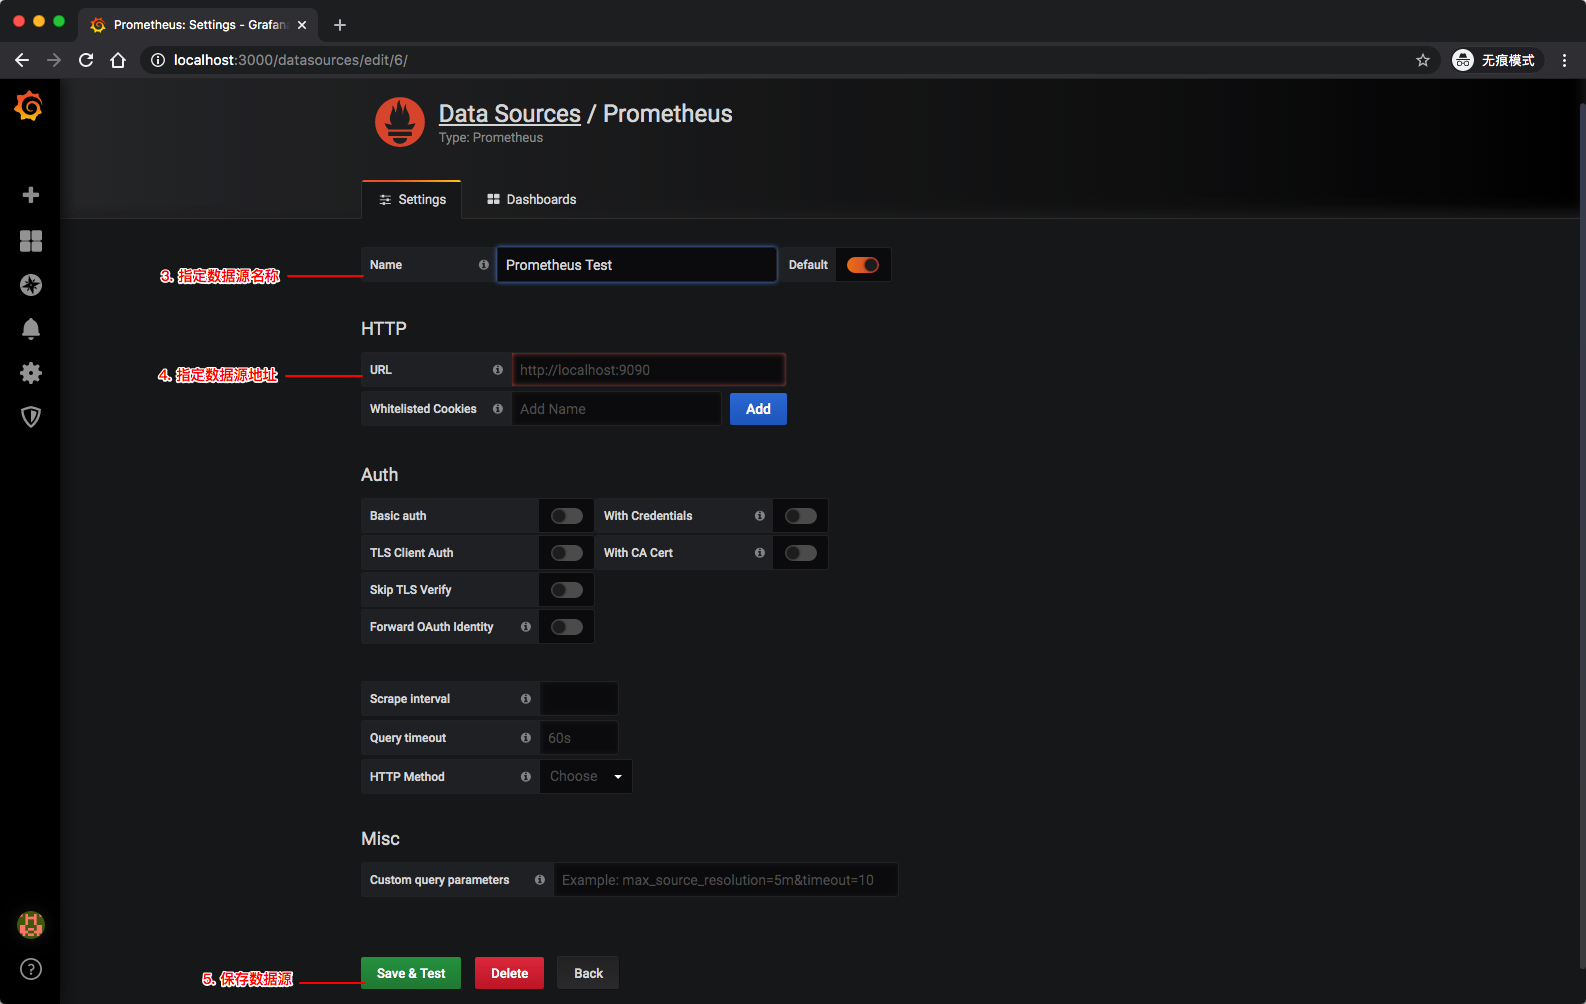
STEP 3:创建 Dashboard
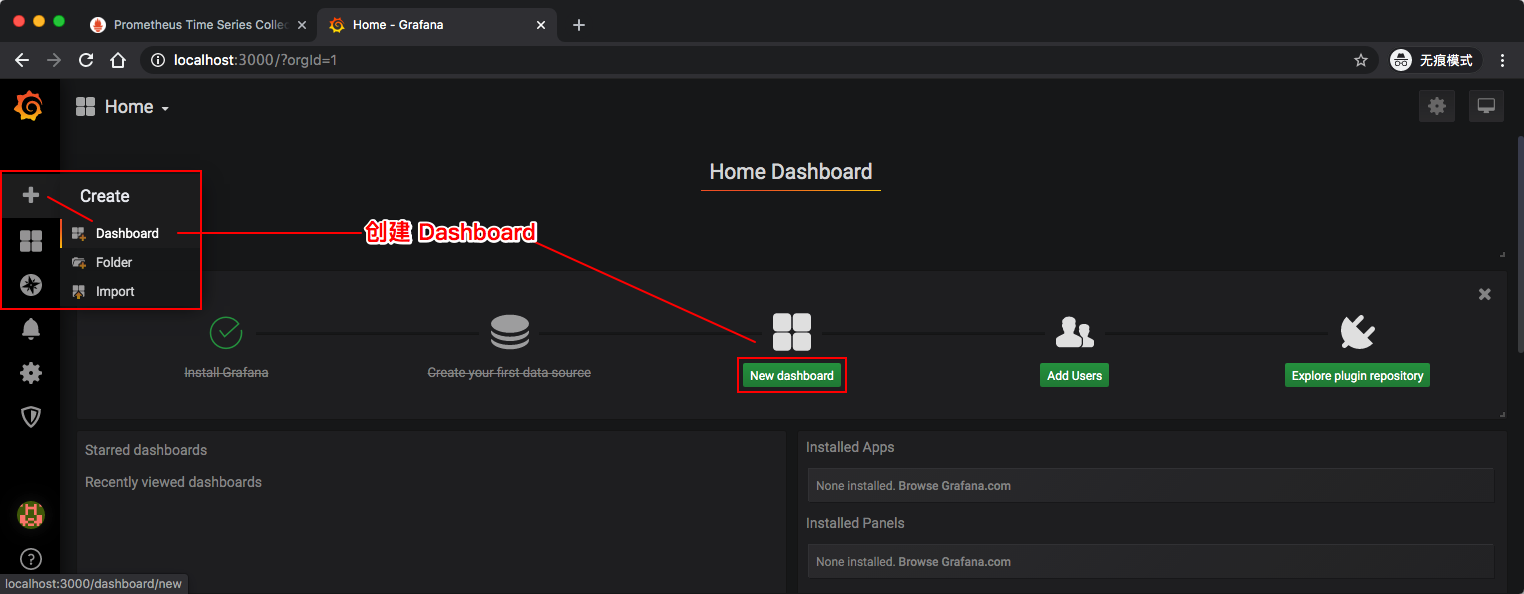
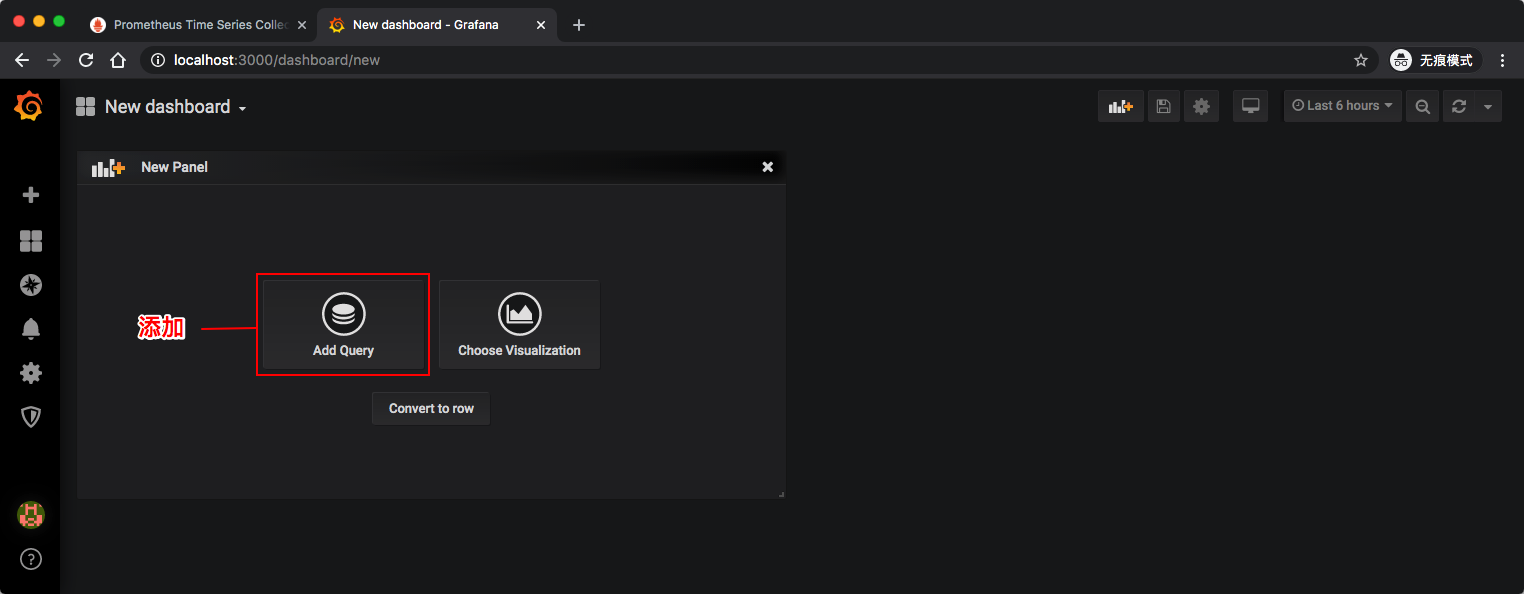
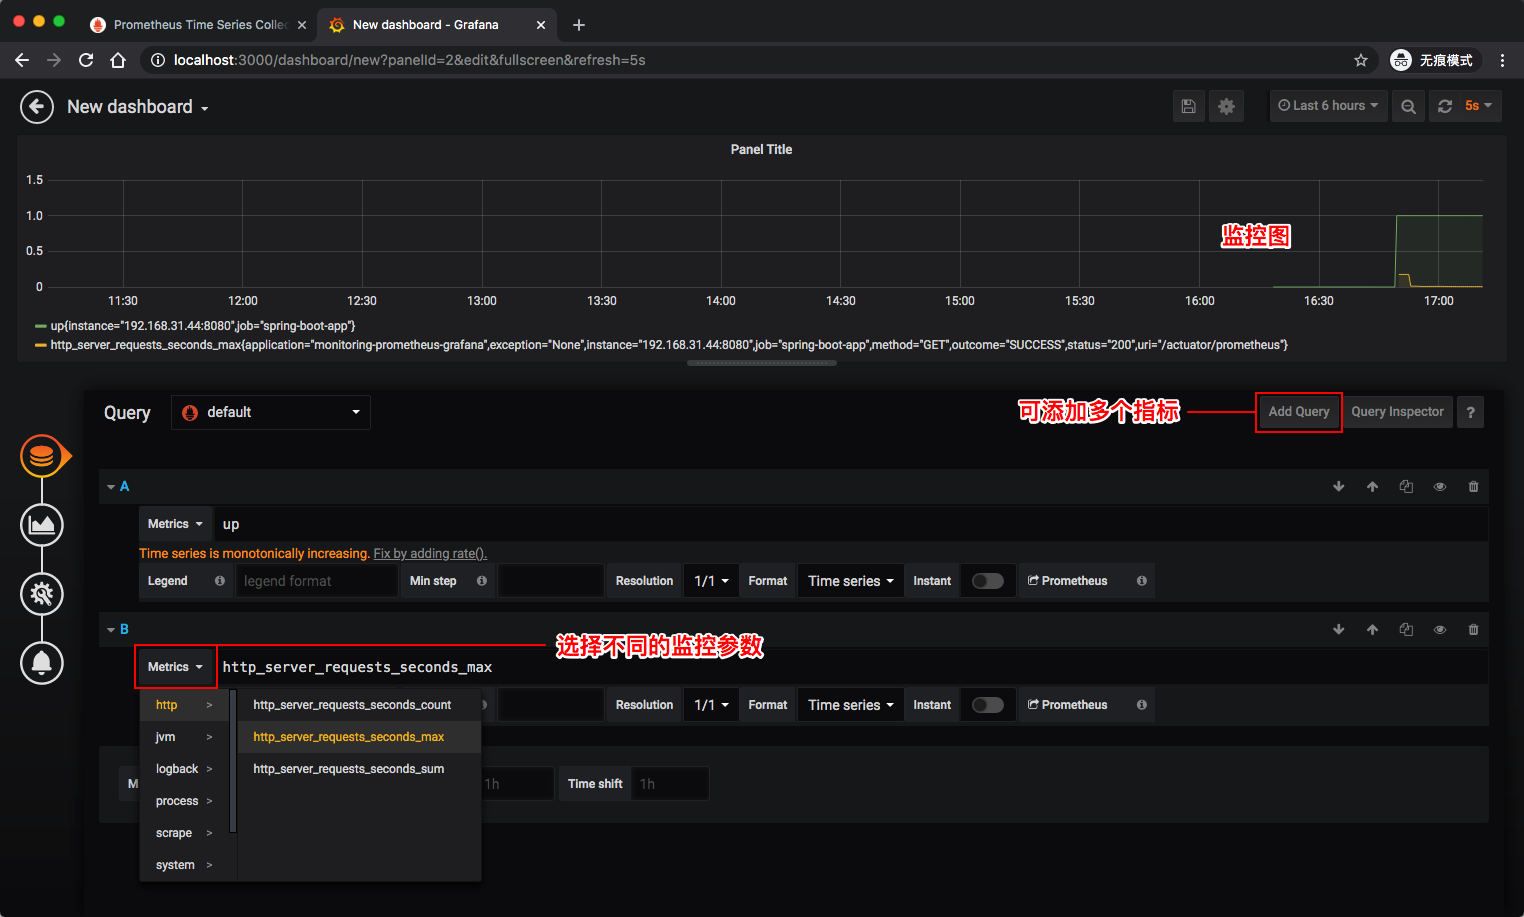
- 设置监控指标
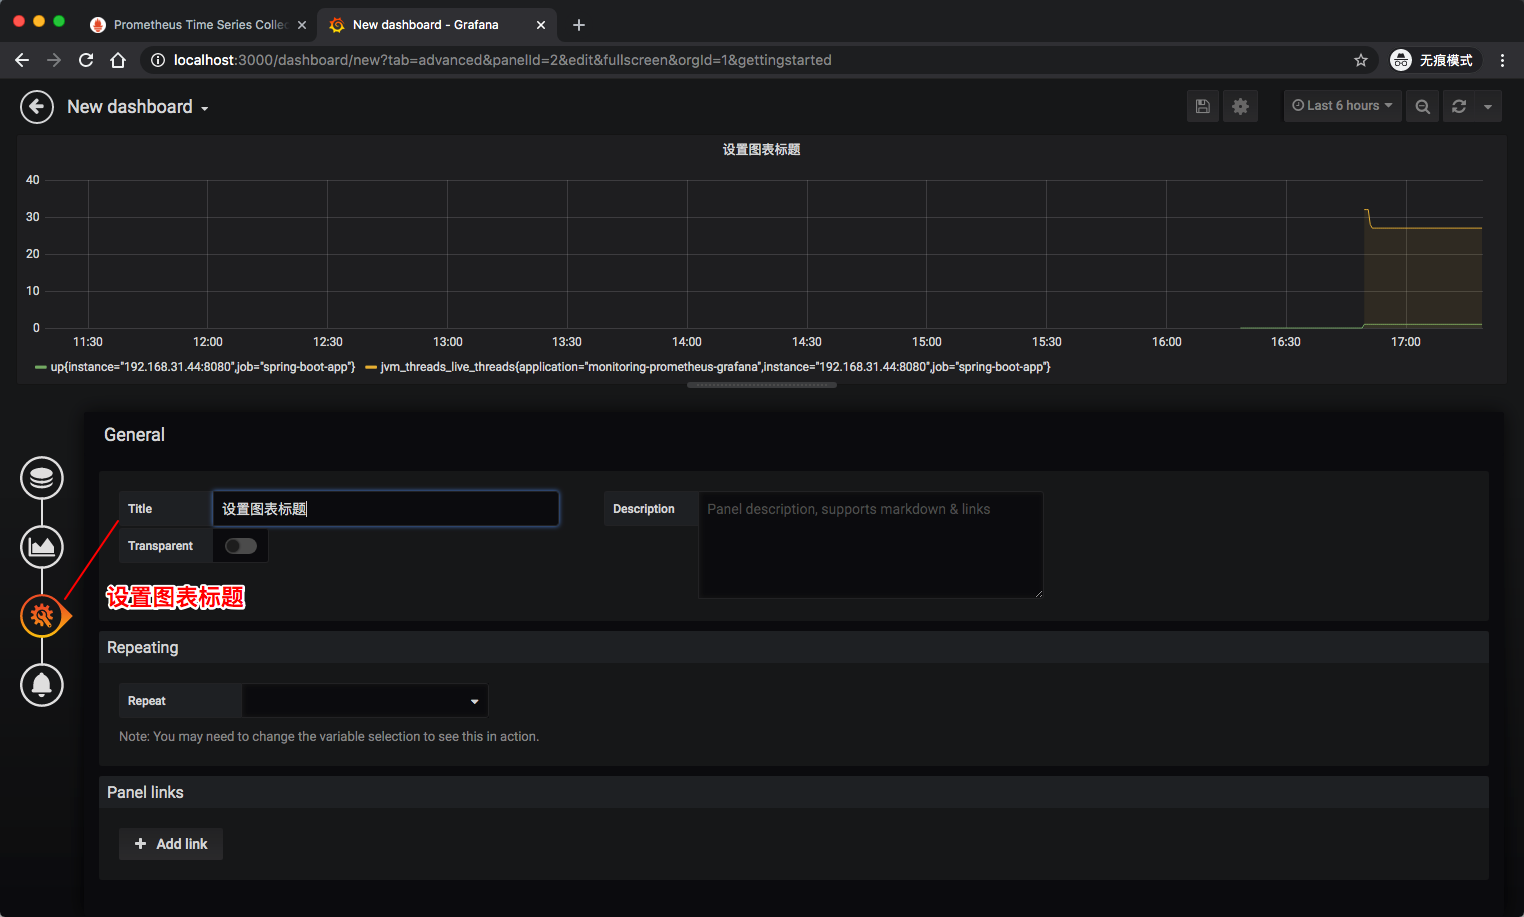
- 设置 Dashboard 信息
- 保存 Dashboard

可以添加不同的指标,指标的取值详见 Spring Boot 应用的 /actuator/prometheus 端点。重复以上步骤操作,即可为 Dashboard 添加新的图表。
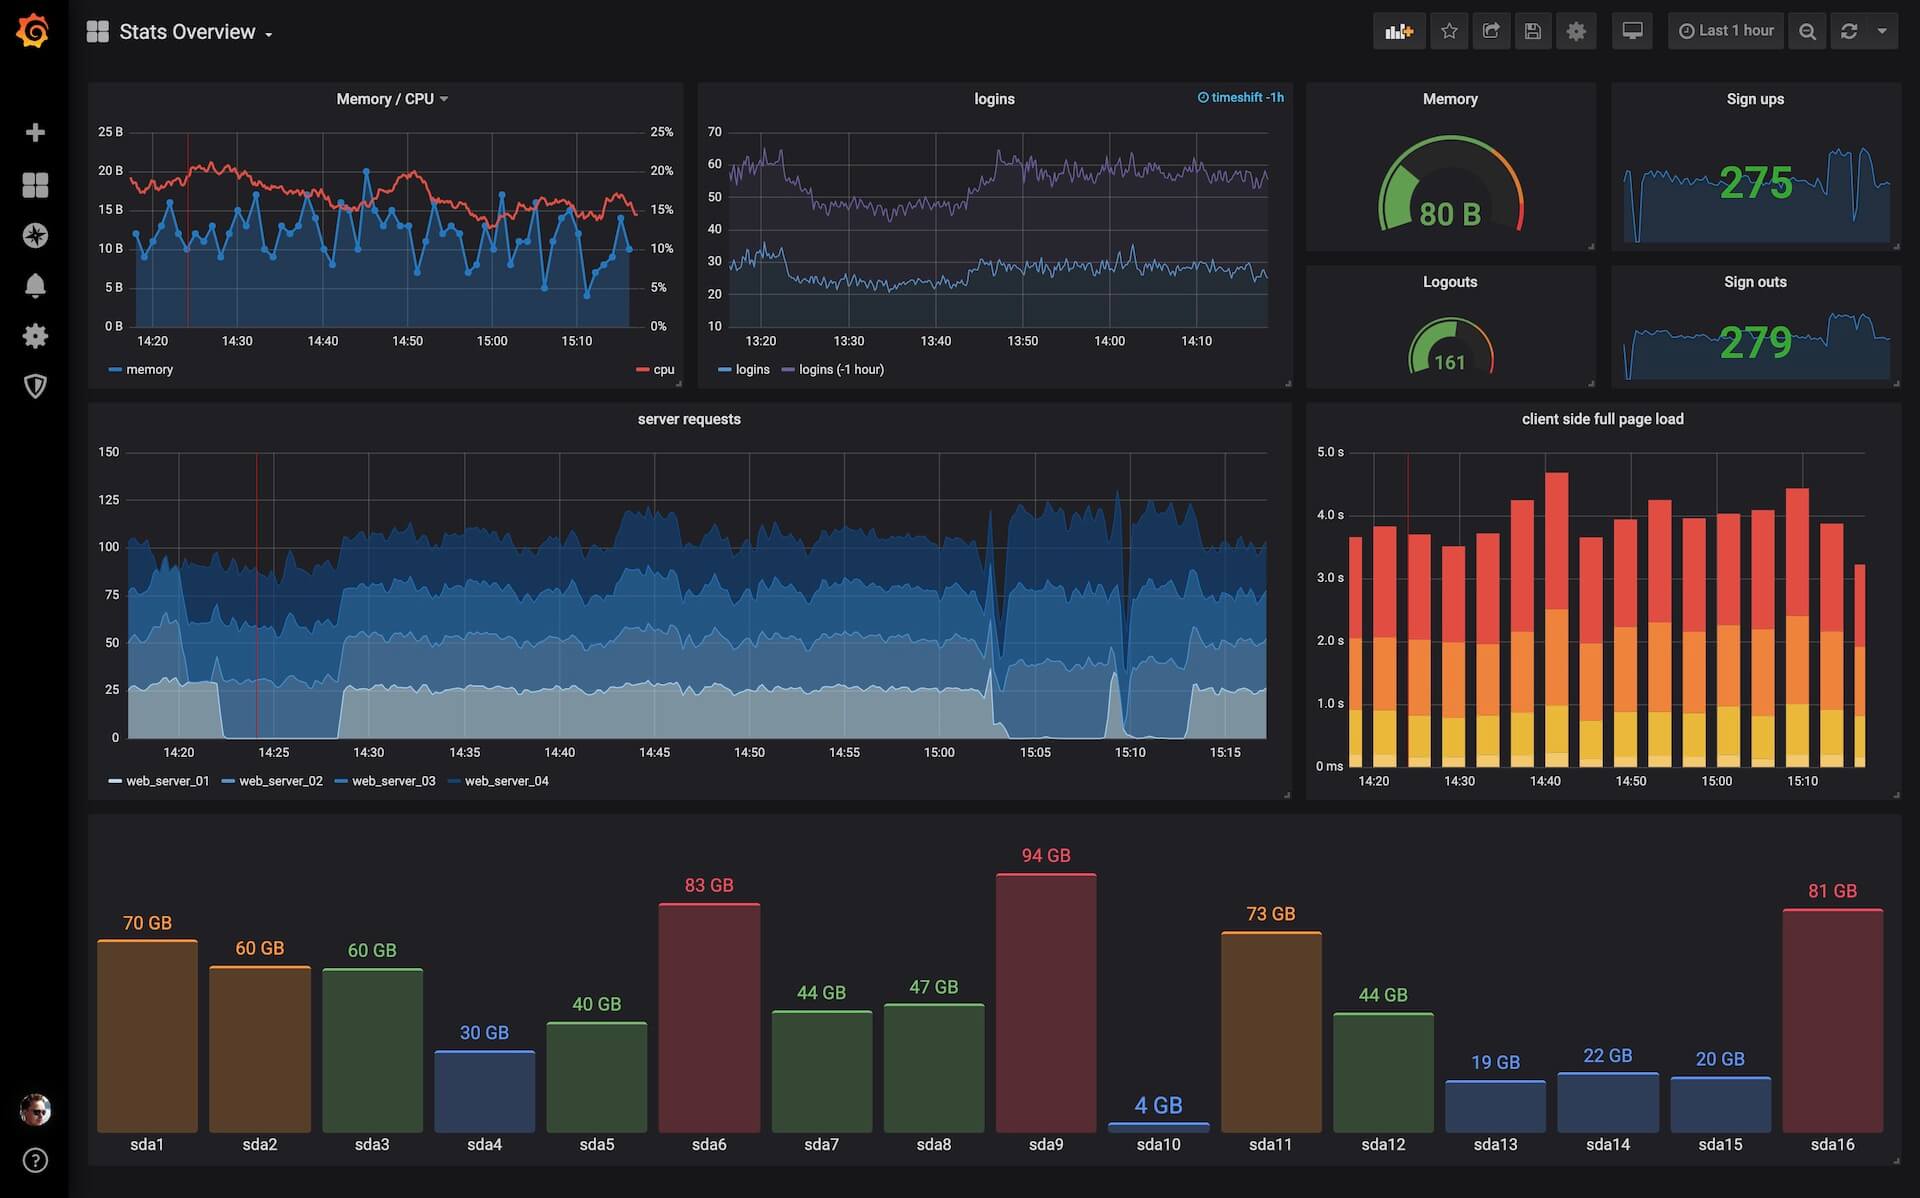
如果你觉得自己定制一个 Dashboard 过于复杂了,那你可以逛一下 Grafana 的 Dashboard 市场(https://grafana.com/grafana/dashboards),这样就可以方便快捷地复用别人精美的 Dashboard 面板了。
参考资料
- https://www.callicoder.com/spring-boot-actuator-metrics-monitoring-dashboard-prometheus-grafana/
- http://www.itmuch.com/spring-boot/actuator-prometheus-grafana/,by 周立
- https://www.baeldung.com/spring-boot-self-hosted-monitoring
- https://yunlzheng.gitbook.io/prometheus-book/
- https://micrometer.io/docs/registry/prometheus
- https://prometheus.io/docs/introduction/overview/
- https://hub.docker.com/r/prom/prometheus/
- https://grafana.com/docs/grafana/latest/